
Spare Parts ABC Analysis: Stocking Fast Movers Without Burdening the Warehouse

The parts business decides whether a dealership or distributor is profitable over the long run. Bikes win customers; parts keep them and carry margins the vehicle business rarely sees. But parts also accumulate silently – every model sold adds a tail of part numbers, and within two or three seasons a warehouse is full of stock that moves once a year while the items customers actually ask for are out of stock.
ABC analysis is the standard tool for preventing that drift. It ranks part numbers by the value they consume, splits them into three classes, and assigns each class a different stocking policy. Its power is not the arithmetic, which is simple, but the discipline: it replaces “stock what we have always stocked” with “stock what consumption proves.”
What the ABC Classification Is
The method ranks every part number by its consumption value – units issued over a period multiplied by unit cost – and then splits the ranked list into classes. The pattern across parts businesses is remarkably stable.
- Class A: typically 10 to 20 percent of part numbers producing about 80 percent of consumption value. These are the fast movers.
- Class B: the next 20 to 30 percent of numbers, producing most of the remainder. Steady but less frequent demand.
- Class C: the long tail – often half the part numbers – contributing a few percent of value. Slow, occasional, unpredictable.
The effect ABC analysis produces comes from the asymmetry: attention and warehouse space are finite, and the classification tells you where they earn a return. A bin of brake pads serves hundreds of customers a season; a bin of crankshaft seals for a model discontinued three years ago serves a memory.
The Data You Need Before Classifying
Twelve months of issue data is the honest baseline – what actually left the counter, not what was ordered or what staff remember. Quarterly data over-captures seasonality; three months under-captures it. Each line should carry part number, quantity, date and the model it was fitted to, because the model link is what lets the classification respond when the lineup changes.
A newly opened dealership has no history, and the substitute is structure: build the first parts order from the spare parts kits the supplier recommends for the models sold, which already concentrate on the items that fail and wear first. Re-classify after two quarters of real issue data, and the local demand pattern replaces the generic one quickly.
Class A: Stocking the Fast Movers Deeply
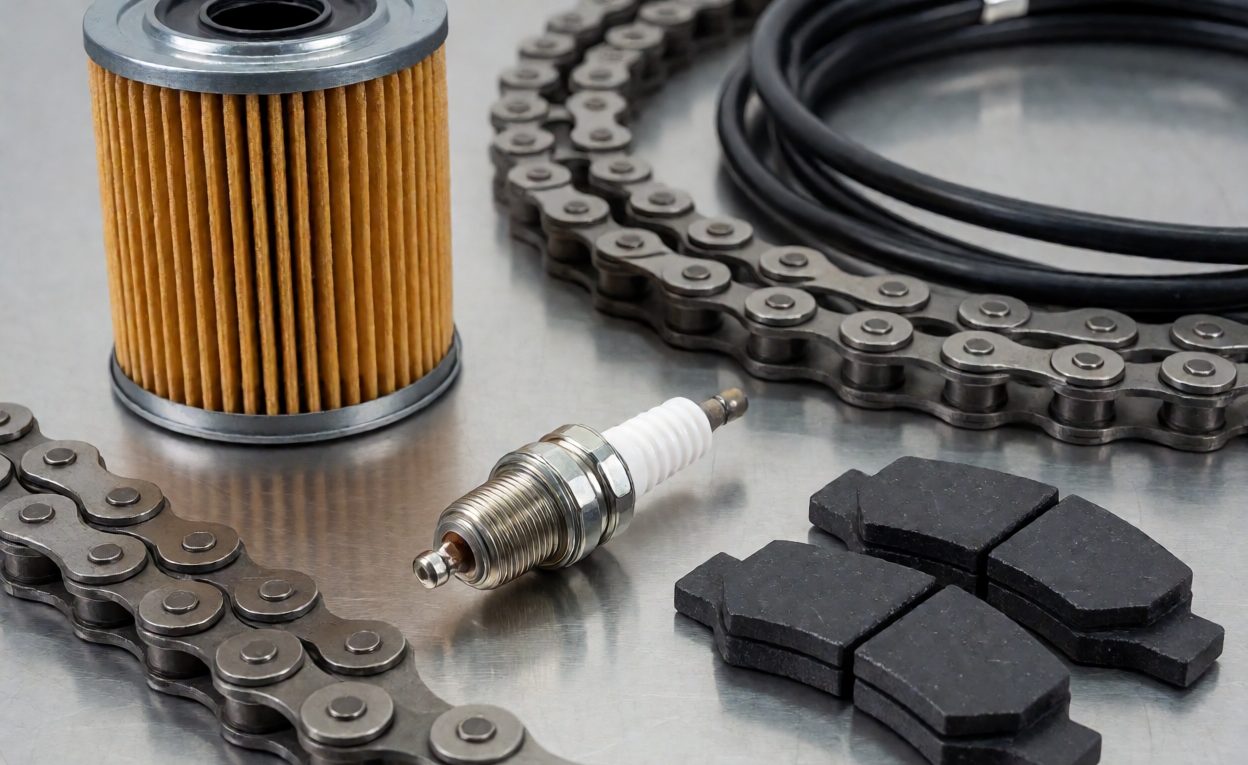
In motorcycle service the fast movers are consistent across markets: engine oil and filters, spark plugs, drive chains and sprockets, brake pads and shoes, control cables, batteries, bulbs, levers, mirrors, tires, inner tubes and clutch plates. None of these are expensive individually. All of them stop a sale or strand a customer when missing.
Class A items deserve the deepest coverage, and the depth is set against two variables: average demand per week and the replenishment lead time from the supplier. Safety coverage exists to absorb the gap between expected demand and reality during the replenishment window – the safety stock calculation formalizes it, and for most dealers a working rule of one to two extra weeks of average demand is enough to keep fill rates high without piling stock. The critical failure mode for Class A is not overstock, it is the quiet stockout: an item that sells constantly gets reordered reactively and runs out at the peak. The fix is a fixed reorder point per item, checked weekly, never left to memory.

Class B and C: Control Without Attention
Class B items justify periodic review – counted and reordered monthly or against each container order – but not daily attention. Class C items are where warehouses go to die, and the policy should be deliberately crude.
- Order C items in lots: buy the box or the dozen, not the unit. Handling cost exceeds the item cost.
- Set a maximum: one lot on the shelf; no replenishment until it is half gone.
- Drop dead stock: no issues in twelve months means no reorder, and a clearance plan rather than another bin.
- Resist completeness: a parts department that stocks every number for every model carries the inventory cost of a much larger business. Coverage of the tail is what backorders and supplier stock are for.
Economic order quantity logic applies mainly at the B and C boundary, where order frequency versus lot size actually trades off against each other. For Class A the lead time and availability dominate, and quantity optimization is a rounding error by comparison.
Fill Rate Is the Metric That Matters
The output of the whole exercise is fill rate – the share of customer demand satisfied from stock at first ask. It should be measured by line item, not by value: filling the oil filter line matters more to the customer than the invoice total. A parts operation running above 90 percent first-ask fill on Class A items converts service into retention; one running at 70 percent converts customers into phone calls to competitors. The mechanics of measuring and managing this, including backorder handling, are covered in the article on parts fill rate and backorder management.
Replenishing Parts Cheaply and Regularly
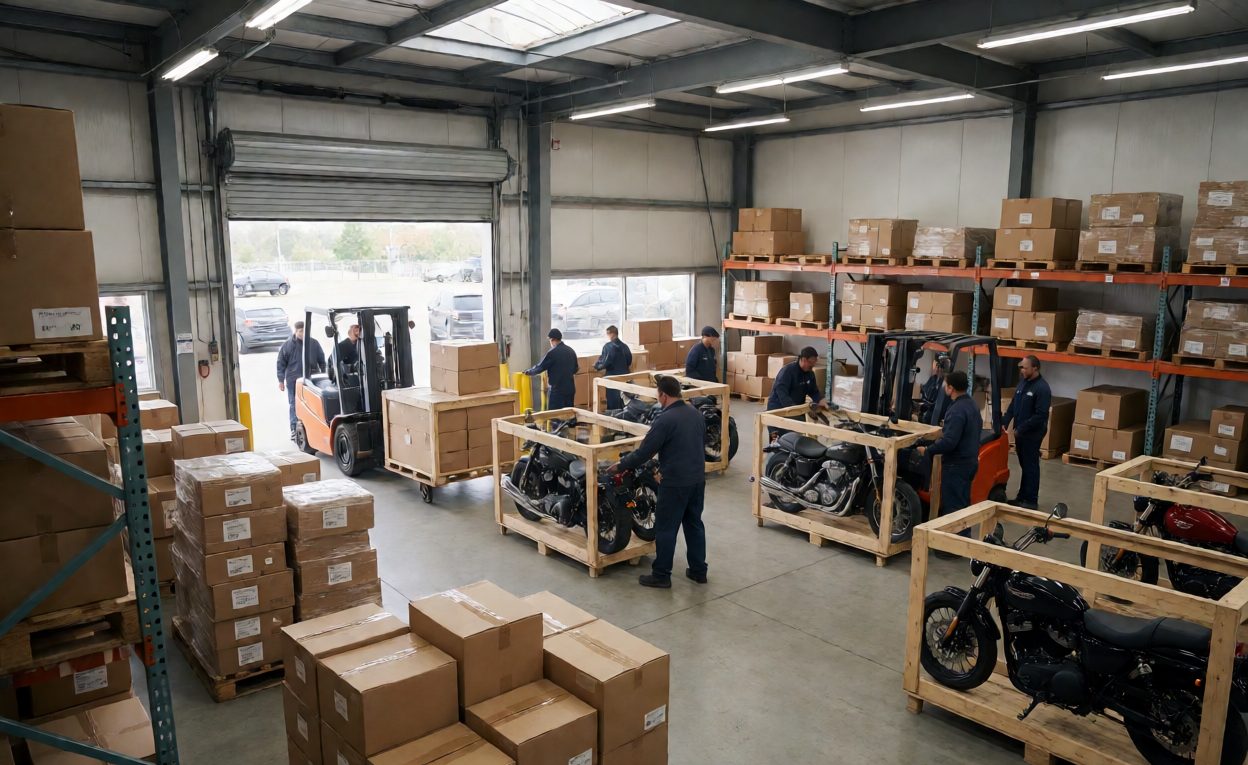
Classification sets what to hold; the ordering rhythm sets what it costs to hold it. The cheapest freight in the parts business is the space left in a container that is moving anyway – the mixed loading described in mixed container planning lets parts ride along with bike orders at marginal freight cost. Aligning the parts reorder cycle with the vehicle order cycle means Class A depth is rebuilt on the schedule the bikes set, and the stock turn and reorder plan keeps both inventories on one review calendar.
One caution closes the loop: the classification is a snapshot, and demand migrates. A model that sells well changes the Class A list within two quarters; a market that shifts toward scooters moves the fast movers with it. Re-run the analysis twice a year, drop the dead tail each time, and the warehouse stays the size the business actually needs rather than the size it happened to grow to.
Frequently Asked Questions
What is ABC analysis in spare parts?
Ranking part numbers by consumption value and splitting them into three classes, each with its own stocking policy.
What share of parts are fast movers?
Typically 10 to 20 percent of part numbers produce about 80 percent of consumption value.
What are the usual motorcycle fast movers?
Oil and filters, spark plugs, chains and sprockets, brake pads, cables, batteries, bulbs, levers, mirrors, tires and tubes.
How much safety stock is enough for Class A?
A working rule of one to two extra weeks of average demand, adjusted to supplier lead time and demand stability.
What should be done with Class C items?
Order in lots, cap at one lot, drop anything with no issue in twelve months.
Why is fill rate measured by line, not value?
Because a missing oil filter loses the customer even when the rest of the invoice is filled.
How often should the classification be re-run?
Twice a year. Demand migrates with the model mix, and the dead tail regrows continuously.